What Is CTR in Analytics? A Complete Guide to Click-Through Rate
If you’ve been searching for what is CTR in analytics, this guide covers the definition, the formula, realistic benchmarks, and practical ways to improve it across ads, email, and organic search.
What Is CTR in Analytics?
To answer what is CTR in analytics simply: CTR (click-through rate) is a metric that measures how often people who see something — an ad, a search result, an email link, a social post — actually click on it. It’s expressed as a percentage and is one of the most widely used engagement metrics in digital marketing and web analytics.
In practical terms, this rate tells you how compelling your headline, creative, or call-to-action is relative to how many people were exposed to it. A high number generally signals that your audience finds the content relevant and worth clicking; a low one suggests the message isn’t resonating, even if it’s reaching plenty of people.
You’ll see it reported across nearly every analytics platform — Google Ads, Google Search Console, Google Analytics, Meta Ads Manager, email service providers, and programmatic ad dashboards all surface it as a core performance indicator.
The CTR Formula and How to Calculate It
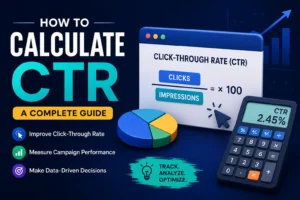
The formula is straightforward: divide the number of clicks by the number of impressions (or emails sent, or search appearances), then multiply by 100 to get a percentage.
For example, if your ad received 1,000 impressions and 25 clicks, the result would be:
(25 ÷ 1,000) × 100 = 2.5%
Why This Metric Matters in Analytics
Once you understand what is CTR in analytics, it’s easier to see why marketers treat it as a top-line KPI. Unlike raw impression counts, which only tell you reach, it tells you whether that reach is translating into interest.
- Quality signal for ad platforms: Google Ads and Meta both factor this rate into Quality Score and ad relevance scoring, which directly affects how much you pay per click and how often your ads are shown.
- SEO diagnostic: In Google Search Console, a low rate for a high-ranking page often means the title tag or meta description isn’t compelling enough, even though the page is visible to searchers.
- Funnel health check: This is usually the first checkpoint in a marketing funnel. If it’s strong but downstream conversions are weak, the problem likely sits on the landing page, not the ad or headline.
- Budget efficiency: A higher rate often means lower cost per click and lower cost per impression, since ad platforms reward engaging creative with cheaper distribution.
What’s a Good CTR? Benchmarks by Platform
“Good” varies a lot by channel, format, and industry, so it’s best used as a comparative metric rather than judged against a single universal number. Here are general benchmark ranges:
| Channel / Format | Typical Range | Notes |
|---|---|---|
| Google Search Ads | 3% – 6% | Varies heavily by industry and intent |
| Google Display Ads | 0.4% – 0.9% | Lower intent, broader reach |
| Facebook / Meta Ads | 0.9% – 1.6% | Feed placements outperform right-column |
| Email Marketing | 2% – 5% | Depends on list quality and subject line |
| Organic Search (Search Console) | 1.5% – 5%+ | Drops sharply as ranking position falls |
| Programmatic Display | 0.05% – 0.3% | Often the lowest of any major channel |
Rather than chasing an abstract “good” number, compare your own rate against your historical performance and against the specific format and industry you’re operating in. Plug in your own clicks and impressions with our calculator to see exactly where you land.
Factors That Influence Performance
- Ad or headline copy: Clear, specific, benefit-driven language consistently outperforms vague messaging.
- Placement and position: Top-of-page or top-of-feed placements almost always earn a higher rate than lower or sidebar positions.
- Audience targeting: A well-matched audience clicks more; broad or mismatched targeting drags performance down regardless of creative quality.
- Visual creative: For display and social formats, image or video quality often has as much impact as the copy itself.
- Device and format: Mobile click patterns differ from desktop, and native ad formats typically outperform traditional banner formats.
- Ad fatigue: Engagement naturally declines over time as the same audience sees the same creative repeatedly.
How to Improve It
- Test headlines and titles rigorously. Small wording changes can move this number significantly — run A/B tests rather than guessing.
- Sharpen your value proposition. Lead with the specific benefit or outcome, not generic descriptions.
- Use numbers and specificity. Concrete details (percentages, timeframes, quantities) tend to outperform vague claims.
- Refine audience targeting. A smaller, better-matched audience often produces a higher rate than a large, loose one.
- Improve visual creative. For image and video formats, test different visuals alongside your copy.
- Rotate creative regularly. Refresh ads and subject lines before performance drops due to fatigue.
- Optimize meta titles and descriptions. For organic search, treat your title tag like ad copy — it directly drives clicks from the results page.
Comparing It to Other Key Metrics (CPC, CPM, CVR)
This metric is most useful when read alongside other core advertising metrics, since each one tells a different part of the performance story:
- Vs. CPM: CPM measures cost per thousand impressions and reflects reach cost, while this metric measures engagement with that reach. A campaign can have a low CPM but weak engagement if the creative isn’t compelling.
- Vs. CPC: CPC is the cost you pay per click. The two are closely linked — a higher rate typically pushes CPC down, since ad platforms reward relevant, high-engagement ads with cheaper clicks.
- Vs. CVR: Conversion rate (CVR) measures what happens after the click — how many clicks turn into signups, purchases, or leads. A strong rate paired with a weak CVR usually points to a landing page or offer mismatch, not an ad problem.
Looking at it in isolation only shows part of the funnel. Pairing it with CPM, CPC, and CVR gives a complete view of both engagement and efficiency.
Want to Calculate Your Own Rate?
Use our free CTR Calculator to work out your rate in seconds, alongside our CPM and eCPM calculators.
Try the CTR CalculatorFrequently Asked Questions
CTR stands for click-through rate. It measures the percentage of people who clicked on a link, ad, or search result out of the total number who saw it, and it’s one of the most common engagement metrics across analytics platforms.
It depends heavily on the channel. Search ads often see a 3–6% rate, while display and programmatic ads are typically well under 1%. Compare your own number to your historical average and to your specific format rather than a single universal benchmark.
Divide total clicks by total impressions, then multiply by 100. For example, 50 clicks out of 2,000 impressions equals 2.5%. Use our calculator if you’d rather skip the manual math.
Not necessarily. A high rate driven by misleading or clickbait messaging can hurt conversion rate and long-term ad quality scores. It should be evaluated alongside conversion rate and cost metrics, not on its own.
High impressions with a low rate usually indicate a mismatch between your audience and your message, weak creative or copy, or poor ad placement. It can also happen naturally with broad-reach formats like display and programmatic advertising.
Final Takeaway
Now that you know what is CTR in analytics, the key is to stop treating it as a number to chase in isolation. Track it alongside CPM, CPC, and CVR for a complete picture, benchmark it against your own channel and industry norms, and treat sudden changes as a signal to test new creative, copy, or targeting.